Client names are withheld. Each case shows the numbers, how the account was run, and, in the fine print, where the evidence stops.
Ad sales, 30 days$2.16M
Ad-attributed sales $2,160,790.12
Ad spend $245,952.06
ACoS 11.38%
ROAS 8.79
Largest account
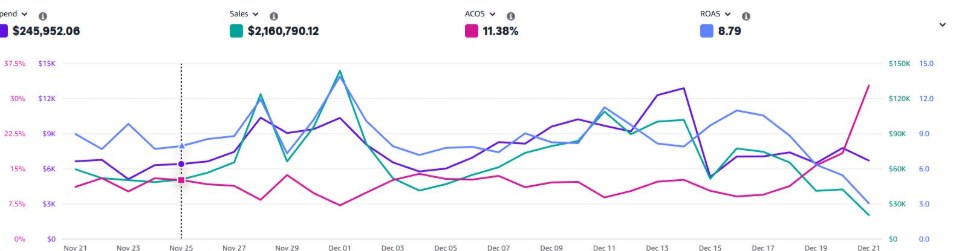
$2.16M in ad-attributed sales in 30 days at 11.38% ACoS
Personal care brand · Amazon US · November 21 – December 21, 2025
Brushes, hair caps and accessories, with about $246K of ad spend in a single month. The goal was to keep scaling sales without letting efficiency decay as spend grew.
Amazon Ads console, November 21 – December 21, 2025. Cropped; campaign list not shown. Tap to enlarge.
Three control loops ran every week. Auto and broad campaigns were harvested and negated so discovery didn’t drift. Brand, non-brand and competitor traffic ran in separate campaigns with their own bid ceilings, and top ASINs were protected with placement rules. Budget moved by intent and margin, and scaled only while TACoS stayed in range.
The founder got a short weekly scorecard: what changed, why it changed, and what happens next week.
Fine print: total sales and TACoS weren’t included in the snapshot, so this case shows ad performance only and makes no before-and-after claim.
ROAS18.16×
Ad-attributed sales $1,112,187.97
Ad spend $61,239.16
ACoS 5.51%
Highest return
$1.11M in ad-attributed sales at 5.51% ACoS
Women’s handbags and accessories brand
The account turned $61.2K in ad spend into $1.11M in ad-attributed sales, with advertising costing 5.51% of that revenue.
$18.16
in ad-attributed sales for every $1 of ad spend
Spend
$61.2K
Ad sales
$1.11M
Three standing rules drove the work. Brand, non-brand, competitor and discovery traffic were separated before any bid changes, since each has different economics. Converting search terms and ASINs were promoted into controlled campaigns and negated where they started, so discovery kept learning instead of paying twice. And placement premiums were paid only where conversion supported them.
Fine print: no comparable baseline, date range, or total-sales view was available for this case, so it makes no before-and-after claim and doesn’t credit the result to any single change.
ROAS10.04
Ad-attributed sales $734,138.50
Ad spend $73,109.25
ACoS 9.96%
Seasonal category
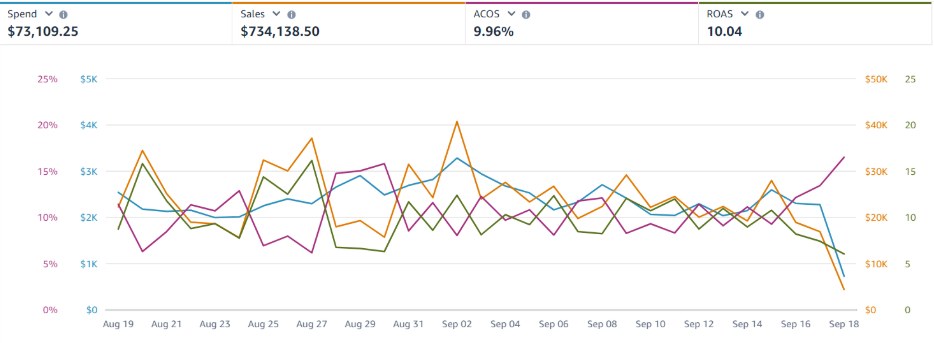
$734K in ad sales at 9.96% ACoS through seasonal swings
Home goods brand · 30-day window, August 19 – September 18
A crowded category where seasonal peaks move CPCs fast and the query mix shifts daily as competitors surge. The focus was protecting margin during peak traffic while sales grew.
Amazon Ads console, 30-day view. Cropped; campaign list not shown. Tap to enlarge.
Week one rebuilt the structure by intent and put guardrails on budgets. From there, converting search terms moved to exact every week and losers were negated fast. Bids and placements followed conversion rate, so budget went only to proven winners, and budget notes were tied to inventory health.
Fine print: segment-level totals and total sales weren’t in the export, so this case makes no before-and-after or TACoS claim.
ACoS8.92%
Ad-attributed sales $244,202.34
Ad spend $21,776.43
ROAS 11.21
Catalog brand
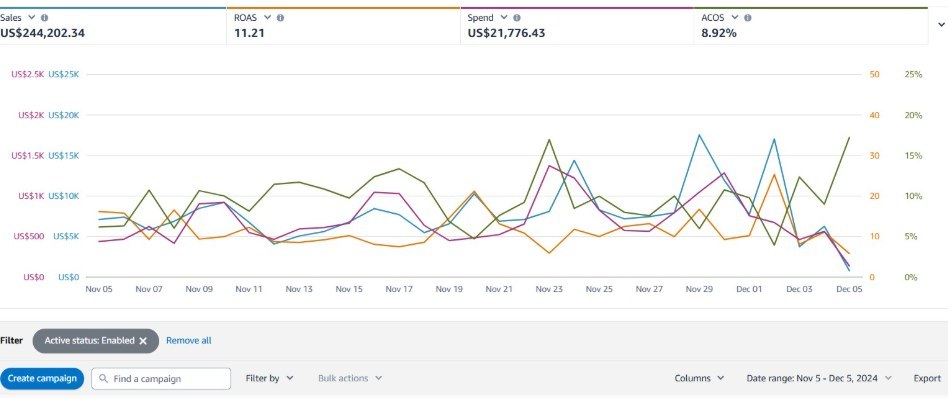
$244K in ad sales at 8.92% ACoS for a designer apparel brand
Designer apparel · Sponsored Products · November 5 – December 5, 2024
A catalog business that needed controlled discovery without losing the exact-match demand it had already earned.
Amazon Ads console, November 5 – December 5, 2024. Cropped; campaign list not shown. Tap to enlarge.
Brand, non-brand, competitor, discovery and exact each had one job. Converting search terms were promoted into controlled exact campaigns and waste was negated weekly. Placement premiums and budget shifts happened only where conversion and margin supported them.
Fine print: no before-and-after baseline, total sales or margin report was supplied, so this case doesn’t claim a turnaround, incremental lift or a TACoS change.
ACoS7.10%
Ad-attributed sales $236,400.97
Ad spend $16,785.89
ROAS 14.08
Thin-margin category
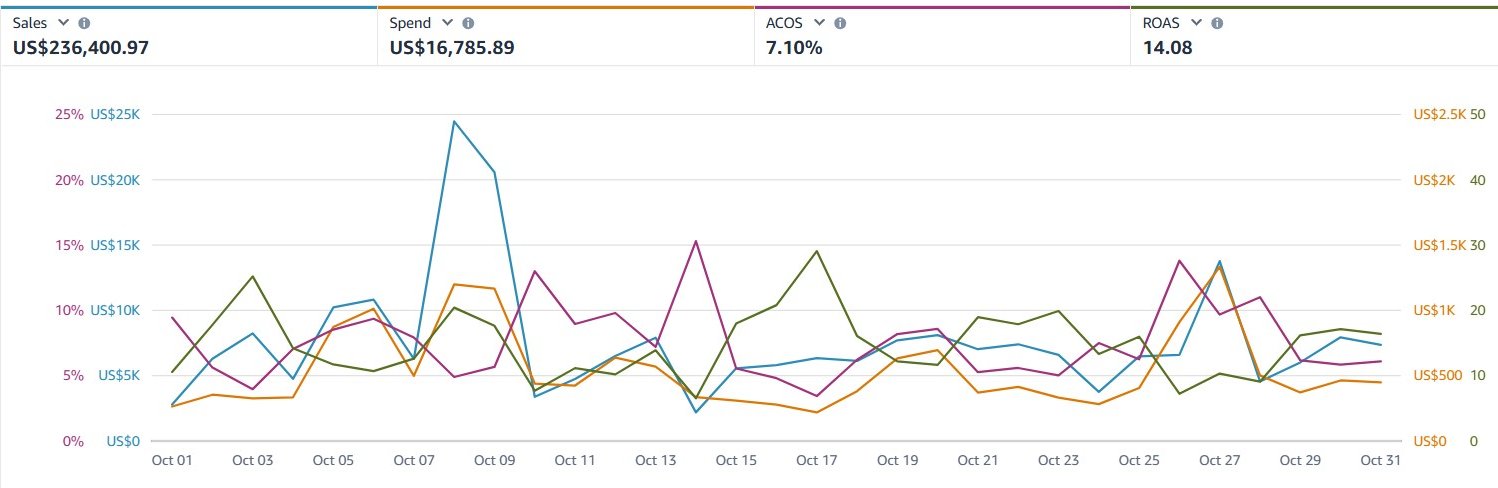
$236K in ad sales at 7.10% ACoS in a thin-margin category
Electronics catalog · Amazon US · October 1–31, 2024
A mixed catalog of audio accessories, surge protectors and streaming devices, where a few points of wasted ACoS can erase a product’s margin. I ran three weekly control loops: harvest converting search terms and negate zero-order spend, tune bids and placement modifiers only where conversion supported them, and move budget from capped tests to proven campaigns.
Amazon Ads console, October 1–31, 2024. Cropped; campaign list not shown. Tap to enlarge.
Daily performance was volatile, with a large sales spike around October 8. The weekly loops kept targeting and budgets aligned as conditions changed.
Fine print: no earlier baseline, total-sales or margin file was available, so this case doesn’t claim incremental lift or total-account profitability.
Zero-order spend$504/mo
Ad spend, 30 days $2,591.91
Ad sales $3,526.81
ACoS 73.5%
TACoS 51.8%
Sample audit
Women’s cosmetics: where $504 a month was going
30-day account snapshot · anonymized
This is what my audit looks like. Sponsored Products took about 90% of spend but returned only 1.11 ROAS, while Sponsored Display (4.70) and Sponsored Brands (2.23) were efficient. Weak negatives let broad and phrase match pull in non-buying searches, and bids weren’t tied to margin.
Most of the budget sat in the weakest ad type
Return on ad spend by ad type, 30 days
Account ROAS 1.36
Sponsored Products
1.11 ≈90% of spend
Sponsored Brands
2.23
Sponsored Display
4.70
0.01.02.03.04.05.0
View as a table
Ad type
ROAS
Share of spend
Sponsored Products
1.11
≈90%
Sponsored Brands
2.23
≈10% combined
Sponsored Display
4.70
Whole account
1.36
100%
1 in every 5 ad dollars bought zero orders
Spend on search terms with no orders, share of 30-day ad spend
$504 zero-order spend (19.4%)$2,592 total
The 30-day plan: stop the waste in week one, separate brand, non-brand and product targeting in week two, scale exact-match winners in week three, then stabilize and report.
Cutting the zero-order spend alone would move ad ROAS from 1.36 to about 1.69 Projected, assuming sales hold while that spend is removed.
Fine print: This is a diagnostic sample, not a completed result. The projection is illustrative and based on a single 30-day snapshot.
You talk to me, not an account manager
Find out what your ads are allowed to cost.
Tell me about your account in two minutes. I review one Search Term Report before we talk, and you leave the call with three findings and a free quote.